


 |
| Kinfisher East Bengal's Full Season Review by fans of Red And Gold |
This article is created by the fans with allegiance to Kingfisher East Bengal. The article was enriched by discussions in the Facebook forum of East Bengal – The Real Power Fan Club and also from articles in the website www.ebrp.in
The document deals in five different sections:
1. Overall Performance
2. Month-wise performance
3. Match Performance
4. Opposition Analysis
5. Players’ Performance
Major Findings:
- EB was a changed team after the derby of 09-December-13. The performance decline started in the aftermath of the infamous walk-out by their arch-rivals
- Primary reason for decline in performance in 2013 compared to 2012 was lack of tightness in defense in 2013
- Goal scoring ability was a major issue all through, in 58% of the matches, EB scored one or less goals
- Loss of points to AI and ONGC matches proved crucial
- EB’s core team consisted of Chidi, Penn, Mehtab, Opkara, Shoumik, Noaba and Arnab – these players spent maximum amount of time in field
- Defensive performance of Arnab and Ishfaq stands out significantly.
- Scoring ability was relatively better after Barisic’s arrival – which proves lack of partners left Chidi stranded upfront
- Ishfaq was the stand-out performer in midfield
For further information, please contact:
1. Satyaki Das: email id – satyakidas123@gmail.com2. Shami Gupta: email id – shami_gupta@yahoo.com
Overall Performance
For many teams in India, a 3rd place finish will be a dream-come-true; but that is not true for East Bengal. A 3rd place finish for East Bengal is deemed as a relative failure. In a tournament where consistency is the key to success, East Bengal appears to have started strongly, but faded away in the later part of the tournament.
Below is the Round Wise progress in points:
|
Position
|
Played
|
Win
|
Draw
|
Loss
|
Goals For
|
Goals Against
|
Points
|
|
All
|
26
|
13
|
8
|
5
|
44
|
18
|
47
|
|
At Home
|
13
|
7
|
3
|
3
|
24
|
8
|
24
|
|
Away
|
13
|
6
|
5
|
2
|
20
|
10
|
23
|
|
1st Leg
|
13
|
8
|
3
|
2
|
20
|
4
|
27
|
|
2nd Leg
|
13
|
5
|
5
|
3
|
22
|
14
|
20
|
Started early of the blocks, and was in very good shape until 1st leg match with Mohun Bagan on 09th December, 2012. After Round 10 (MB Match), EB were at 24 points, with 7 wins and 3 draws. Post 09th December, EB managed 23 points from 16 matches with 6 wins, 5 draws and 5 losses. The dreadful walkover took its direct toll on arch-rivals MB, but it appears that it took its toll on EB too.
East Bengal's Points Accumulation Curve:
 |
| East Bengal's Points Accumulation Graph for i-League Season 2012-13 |
The 2012-13 i-league ran from October’12 till May’13. In this section the result is bifurcated by months.
|
Played
|
Win
|
Draw
|
Loss
|
GF
|
GA
|
Points
|
PPM
|
GSPM
|
GCPM
|
GDPM
|
|
|
Oct'12
|
3
|
2
|
1
|
0
|
2
|
0
|
7
|
2.3
|
0.67
|
0.00
|
0.67
|
|
Nov'12
|
5
|
4
|
1
|
0
|
13
|
1
|
13
|
2.6
|
2.60
|
0.20
|
2.40
|
|
Dec'12
|
5
|
2
|
1
|
2
|
7
|
3
|
7
|
1.4
|
1.40
|
0.60
|
0.80
|
|
Jan'13
|
5
|
3
|
0
|
2
|
8
|
6
|
9
|
1.8
|
1.60
|
1.20
|
0.40
|
|
Feb'13
|
2
|
1
|
1
|
0
|
2
|
1
|
4
|
2.0
|
1.00
|
0.50
|
0.50
|
|
Mar'13
|
2
|
0
|
2
|
0
|
3
|
3
|
2
|
1.0
|
1.50
|
1.50
|
0.00
|
|
Apr'13
|
1
|
0
|
1
|
0
|
1
|
1
|
1
|
1.0
|
1.00
|
1.00
|
0.00
|
|
May'13
|
3
|
1
|
1
|
1
|
8
|
3
|
4
|
1.3
|
2.67
|
1.00
|
1.67
|
PPM: Points per match;
GSPM: Goals Scored per match
GCPM: Goals Conceded per match
GDPM: Goal Difference per match
The tightness in defense was considerably lesser in 2013 than in 2012. Goals scored per match remained consistently below two (which indicates low scoring ability), the striking performance was good in November’12 when there were big wins against AI (0-3), Churchill (0-3) and ONGC (5-0). In May’13, 6-0 win against Sikkim was the best result of the team in the whole league.
The graph below provides the relative form of team by months. The straight line provides indicator of the champion, Churchill Brothers, at the end. EB was ahead of the curve at the start of the league, but could not keep pace after R10. Performance in Mar’13, Apr’13 and May’13 can be termed “POOR”.
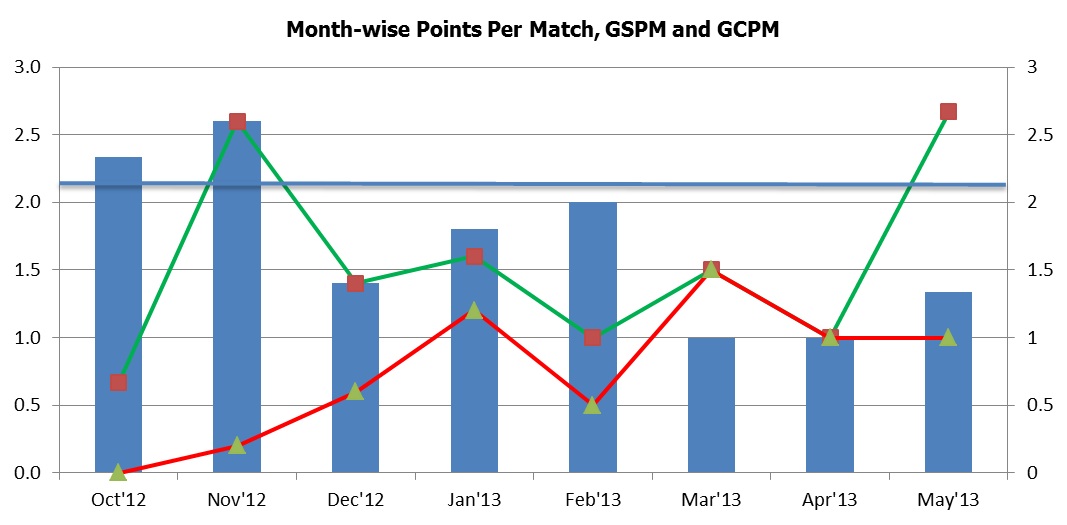 |
| Month Wise Points Per Match, GSPM and GCPM, East Bengal , i-League 2012-13 |
Match Performance
A game starts in balance and then as teams score, there can be a TRAILING or LEADING situation. In this section, we take the cumulative minutes when EB has trailed, led or were in deadlock situation.
- A large percentage in deadlock indicates: A team is unable to pick up early goals, or is unable to hold lead
- A large percentage in lead indicates: A team is able to score and hold its lead
- A large percentage in trail indicates: A team concedes early goals and is unable to retaliate
Of the 2,340 minutes of i-league competition, EB was in deadlock for 1,295 minutes, in lead for 802 minutes and were trailing for 243 minutes.
 |
| A Pie Chart showing East Bengal's season Match Performance |
While there was a probable weakness in the team in terms of breaking deadlocks, EB were generally able to hold the lead. On the rare occasions EB trailed, EB were able to retaliate quickly. EB never trailed in 17 of the 26 games, and never led in 9. EB were not prolific scorers, but remained relatively composed in defense. In 58% of matches EB scored 1 or less goals, which proves weakness in offense. In 85% of the matches EB conceded 1goal or less, including 13 clean sheets, which proves strong defense.
|
|
No Goals
|
1 goal
|
2 goals
|
3 goals
|
4 goals
|
5 or 5+ goals
|
|
Scored
|
7
|
8
|
5
|
3
|
1
|
2
|
|
Conceded
|
13
|
9
|
3
|
1
|
0
|
0
|
To get further indication, we now divide every game into four parts and check goals scored and conceded in the period:
1. First 15 minutes – The Early Period
2. Between 16 – 45 minutes
3. Between 46 – 75 minutes
4. Last 15 minutes – The late onslaught
The section below gives the goals scored (a total of 42 and not 44, as two goals were awarded) and goals conceded (a total of 18). While 60% goals were scored and conceded in 2nd half.
 |
| A review of East Bengal's Goals Scored And Goals Conceded in i-League 2012-13 |
- Early goals were not common, but on all five occasions in which EB scored within first 15 minutes, EB won the match. This reiterates the importance of scoring early and seizing initiative
- Largest victory margin for 6-0 win at home against United Sikkim FC on 8-May-2013; while the worst defeat was 0-3 at home against Churchill Brothers on 19-Jan-2013
- In 1st half of the games, EB scored 17 and conceded 7 (goal difference of +10)
- In 2nd half of the games, EB scored 25 and conceded 11 (goal difference of +14)
- EB played 3 goalless draws (SC Goa, Shillong Lajong FC and Mohun Bagan)
- EB led and conceded goal(s) to draw in 3 occasions (Dempo SC, Air India, Prayag United matches). The equalizing goals were conceded in 82nd min, 90th min and 66th min respectively
- EB came back from behind to salvage points on 3 occasions (Salgaocar FC, Pailan Arrows and SC Goa); in the first two occasions EB went on to win the matches and on both occasions, goals were conceded within first 10 min of the game. SC Goa went into lead on 44th min.
Opposition Analysis
In head-to-head, EB lost to Prayag United and Shillong Lajong FC, though the final match with Lajong was inconsequential. Vital points were dropped against teams in bottom half of the table, e.g.: Air India, ONGC, Shillong Lajong FC. 8 points lost against these teams proved crucial in the outcome. Marque performance was against Pune FC.
|
|
Home
|
Away
|
Home Score
|
Away Score
|
Earned Points
|
Opposition Point
|
|
Churchill Brothers
|
L
|
W
|
0-3
|
0-3
|
3
|
3
|
|
Pune FC
|
W
|
W
|
1-0
|
1-2
|
6
|
0
|
|
Prayag United
|
L
|
D
|
0-1
|
2-2
|
1
|
4
|
|
Dempo SC
|
D
|
D
|
1-1
|
2-2
|
2
|
2
|
|
SC Goa
|
D
|
D
|
1-1
|
0-0
|
2
|
2
|
|
Salgaocar FC
|
W
|
W
|
1-0
|
1-4
|
6
|
0
|
|
Mumbai FC
|
W
|
L
|
2-0
|
2-1
|
3
|
3
|
|
ONGC
|
W
|
L
|
5-0
|
1-0
|
3
|
3
|
|
Mohun
Bagan
|
W
|
D
|
3-0
|
0-0
|
4
|
1
|
|
Shillong Lajong FC
|
L
|
D
|
0-1
|
0-0
|
1
|
4
|
|
Pailan Arrows
|
W
|
W
|
3-0
|
1-2
|
6
|
0
|
|
Air India
|
D
|
W
|
1-1
|
0-3
|
4
|
1
|
|
United Sikkim FC
|
W
|
W
|
6-0
|
0-1
|
6
|
0
|
Relative performance against of top i-league teams suggests that EB dropped far too many points against the lower teams. Inability to break defensive sides consistently, incredible misses and dropping concentration at crucial moments all culminated in securing only third position, for a potentially champion team.
|
|
Top 5
|
Mid 5
|
Last 4
|
Total
|
|
Churchill
|
14
|
19
|
22
|
55
|
|
Pune
|
9
|
23
|
20
|
52
|
|
EB
|
12
|
18
|
17
|
47
|
|
United
|
11
|
12
|
21
|
44
|
|
Dempo
|
9
|
15
|
16
|
40
|
Players Performance
On-field i-league campaign lasts for a daunting 2,340 minutes. Of the registered 30 players, EB utilized a total of 24 players under various circumstances. Of these players, Alvito played in two matches for only 4 minutes, and is not part of analysis of this section.
 |
| East Bengal's Players Performance graph for i-League 2013-14 |
Firstly, let us look into the time spent by players in-field. This will represent the team composition. We divide it by 1st leg to 2nd leg. We notice that Abhijit, Gurwinder, Raju, Robert, Lobo, Dika, Robin and Baljit got more playing times in the 2nd leg than in the 1st leg. On the contrary, Gurpreet, Khabra, Saumik, Ishfaq, Arnab and Manandeep played a lot lesser in the 2nd leg.
 |
| on-field utilization of 24 players of East Bengal |
Chidi, Penn and Mehtab clocked more than 80%, with Chidi clocking a whopping 95% of time-in-field. Along with these three, the nucleus of the team is formed with Opkara, Arnab, Naoba and Shaumik – all these players were on-field for more than 60% of the time. TJM decided to play Dika and and Lobo in 2nd leg in lieu of Khabra and Ishfaq.
*Of the core group, Penn will be missed in 2013-14.
In the next section, we check the utility of the players in-field. Defense will be judged by lower number of goals conceded per minute in field, while offense will be judged with respect to higher number of goals scored per minute in field. The midfield will be judged in conjunction of both.
1. Defender Utility: Minutes in field/ Goals conceded
2. Forward Utility: : Minutes in field/ Goals scored
EB overall Utility:
1. Defense Utility = 130 – which means EB conceded a goal every 130 min in this i-league
2. Forward Utility = 55.7 – which means EB scored a goal every 55.7 min in this i-league
For individual players, the above numbers are bench mark; we find positive or negative impact of the players. (0 represents team performance) – Blue: Defense index, Red: Offense Index.

With respect to the team performance, defensive utility of Arnab and Ishfaq stands out significantly. Naoba and Saumik are also critical to the team. With Ishfaq in ground, EB conceded a goal every 220+ minutes, and with Arnab in field EB conceded every 180+ min vis-à-vis an average of a goal conceded every 130 min. Similarly, playing Barisic improved the goal scoring significantly, to a goal every 35 min as compared to a team average of a goal every 56 min. This again reiterates the improved performance of EB in AFC Cup when all four foreigners can play.
Individual brilliance or mistakes are the factors that are not addressed by the statistical representation above and we intend to address it in the next year’s review.
Please email your feedback to the authors or drop down your comments below and we would like to incorporate your suggestions.
ABCDFootball would like to thank the supportive fans of East Bengal who were kind enough to share their work with us and give the readers a chance to review their compilation.
0 comments:
Post a Comment